
Advertising analytics and reports
Under Analytics → Advertising you see how your ads perform, per campaign, per advertiser or across all campaigns. From inside a campaign, Analytics takes you straight here.
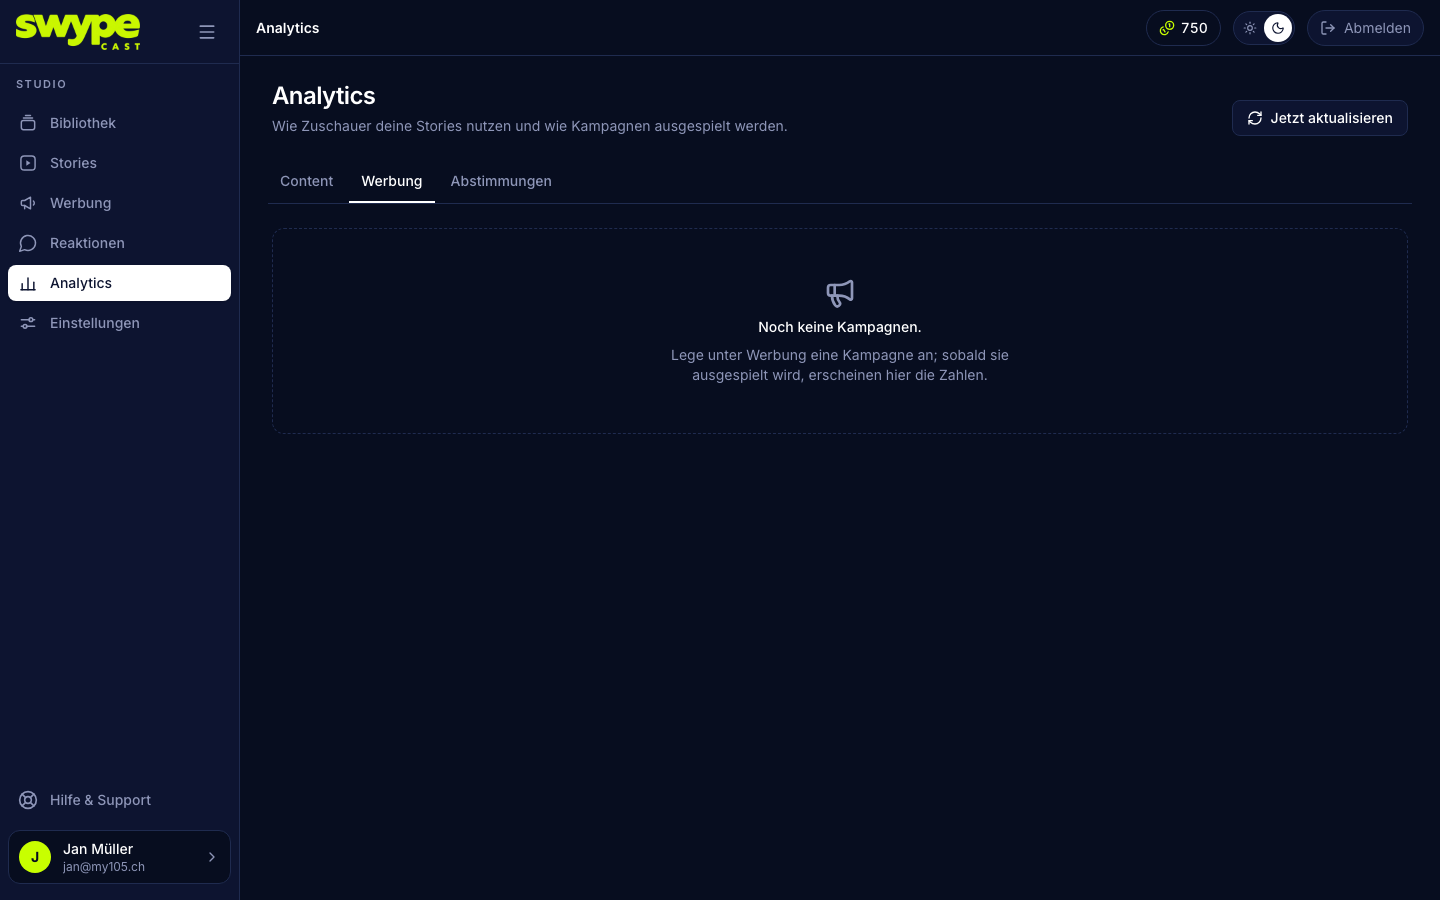
Choose the view
- Campaign: a single campaign. The search field and status filter help you find it.
- Advertiser: all campaigns of one client.
- All campaigns: all your advertising.
Then choose the period as in content analytics: 7, 30 or 90 days, or From and To. For a single campaign a badge shows the pacing (on track, behind, ahead).
The figures
- Impressions in period: how often an ad was visible for at least two seconds.
- Actual vs. target (total): delivered impressions against the campaign's goal, with the expected state up to today. In the Advertiser and All campaigns views this tile shows the number of campaigns.
- Completion rate: the share of ads that played to the end.
- CTR: clicks on the button, relative to impressions.
- Skip rate: the share of ads that were skipped.
- Fill rate (booked stories): how many ad slots in the booked stories were filled with an ad.
- Frequency per session: how often a person saw the advertising on average.
- Decisions: how often the campaign was chosen for an ad slot.
Below you find the delivery per day (impressions, completes, clicks) and tables Per creative, Per story and, except in the campaign view, Per campaign.
Report for your client
CSV or PDF report export the chosen view and period. The PDF report is meant to be passed on: header with the advertiser's address, key figures and tables per creative, story and day. You get the report for a campaign's whole run time directly in the campaign, see Advertisers and reports.