
Analyse votes and polls
When you place a vote, a poll or a barometer on a clip in the editor, every answer lands in its own report. New answers show up right away, there is nothing to refresh.
Where to find it
Analytics → Voting. As long as no clip carries such an element, the page only shows a hint with the way into the Clip Creator.
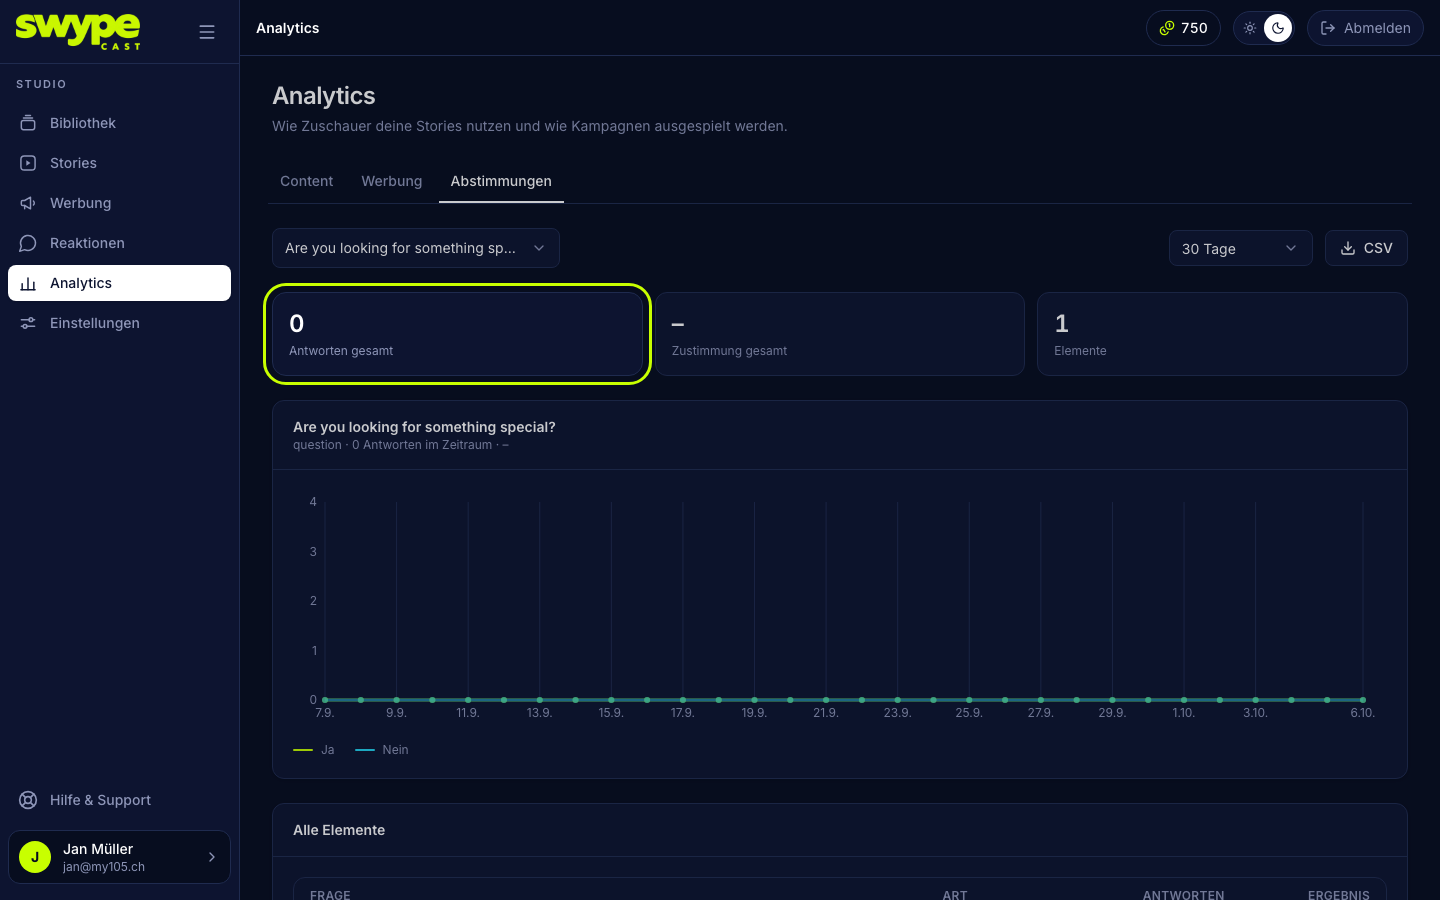
What you see
- Total answers: all answers in the chosen period.
- Total approval: the share of yes votes across all elements.
- Elements: how many votes, polls and barometers have answers.
The All elements table lists each element with question, clip, kind, number of answers and result. The result depends on the kind:
- Vote: share of yes in percent.
- Poll: the leading answer with its share.
- Barometer: the average of all answers in percent.
If a clip carries several elements, each gets its own row.
Look at one question more closely
- Click the Question field at the top and search for the question you care about.
- The card below shows kind, number of answers and result of that question.
- The chart shows yes and no per day. That way you see whether the mood shifts.
Choose the period
Top right you pick 7, 30 or 90 days or a custom range. Figures, table and chart always refer to this period.
Download as CSV
A click on CSV downloads a file for Excel or Numbers. It contains:
- every element with question, kind, clip, answers, yes, no, approval and average,
- for each poll its own table with all answers, votes and shares,
- the daily values of one question.
What is not here
Answers to an open question are comments. You find them under Reactions, where they also go through moderation. How to create a vote, poll and barometer is explained in Votes on a clip.
Plans
Vote and poll are available from the Team plan, the barometer from Pro.